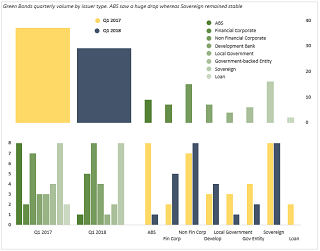
Climate Bonds Charts Yesterday I saw a post on LinkedIn where the Lux Stock Exchange was sharing some charts done by Climate Bonds. The full report can be found here. By looking at the charts I thought
Category Archives: Excel
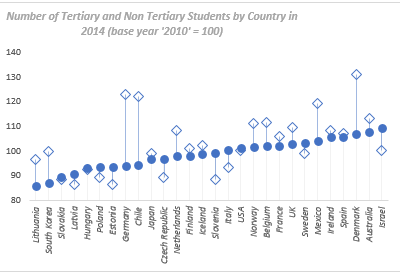
The Data While browsing the internet looking for students data, I stumbled upon one chart on the OECD website which was plotting number of students by Country divided between tertiary and non tertiary sectors. In

Excel Marimekko Charts Excel Marimekko Charts are a great way of displaying market or sales data for different companies competing in the same sectors. Download the file Imagine you had the following data: You have

Excel VBA – Number to Letters Series Progression The other day I saw a forum question where somebody wanted to convert a number to a letter sequence going from A to Z (26 letters in

Ranking in Excel You can use two different function for ranking in Excel: RANK.EQ and RANK.AVG. These two functions do essentially the same job but return different results for the items in your data set that

Scatter Chart for Countries Education Performance I found some interesting data on the OECD website ranking Countries Education Performance of 15 years old from one year to another which I thought would make an interesting

Excel Dependent Drop Down Lists Using Tables A common question I see being asked on Excel forums is how to create Excel dependent drop down lists, that is to say that the list you get
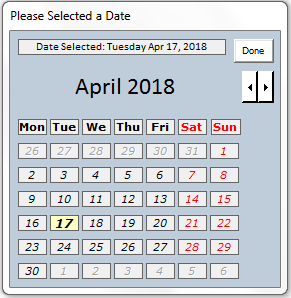
Custom Excel Date Picker Issue with the MonthView Control Click to Download the Custom Excel Date Picker Excel does not really provide a good way for the user to pick a date from a calendar
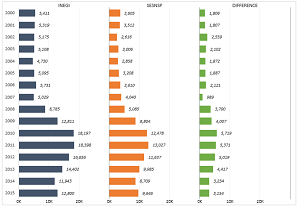
Panel Bar Chart The other day I came across a data visualization website which inspired me to replicate some of the graphs in Excel. The data shows gunfire homicides in Mexico between 2000 and 2015