Climate Bonds Charts
Yesterday I saw a post on LinkedIn where the Lux Stock Exchange was sharing some charts done by Climate Bonds.
The full report can be found here.
By looking at the charts I thought there were ways to improve them, especially the stacked bar chart comparing data of Q1 2017 with Q2 2018 which makes it a bit difficult to discern which issuer types have gone up or down and by how much.
Since I was not able to find the tabular data, I tried to rewrite it manually by looking at the charts.
The Excel file with the charts can be downloaded here
Chart comparing Q1 2017 and Q1 2018 by Issuer Type
The first chart proposed is this one:
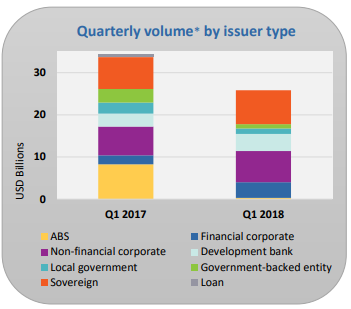
Climate Bonds Chart
Except for ABS, the task of seeing who is going up or down from one quarter to another is not so easy. An alternative chart is the one below where the movements are seen more clearly (right click the image and choose Open Image in a New Tab to see it in a better resolution):
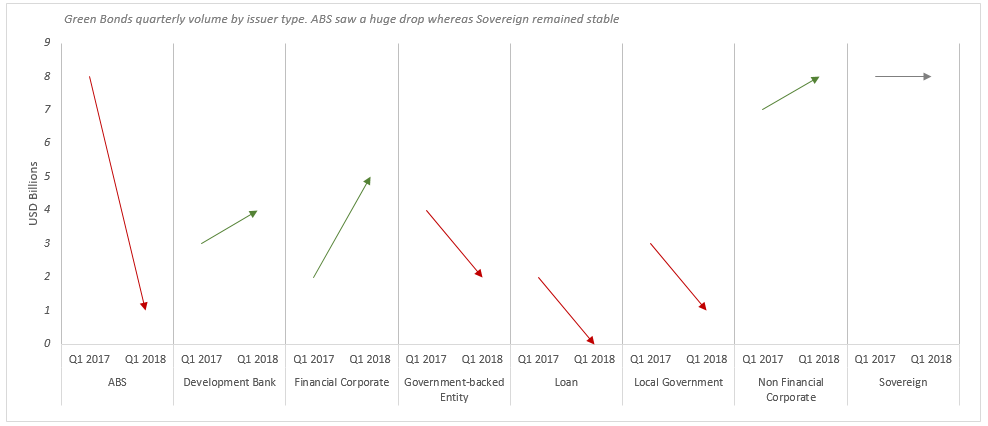
Excel Panel Charts
Or if we wanted to stick with bar charts, perhaps a clustered bar chart:
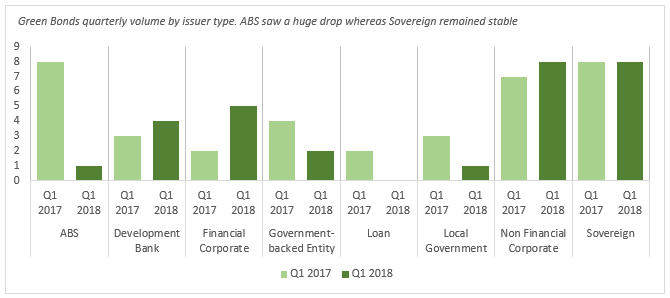
Excel Clustered Bar Chart
Or we could build a panel stacked bar chart showing relationships between quarters and sectors:
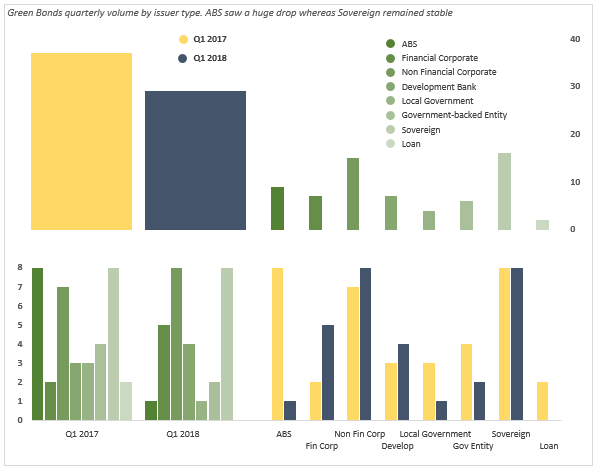
Excel Panel Charts
Another option is to create an interactive line chart where it is possible to select one issuer at a time:
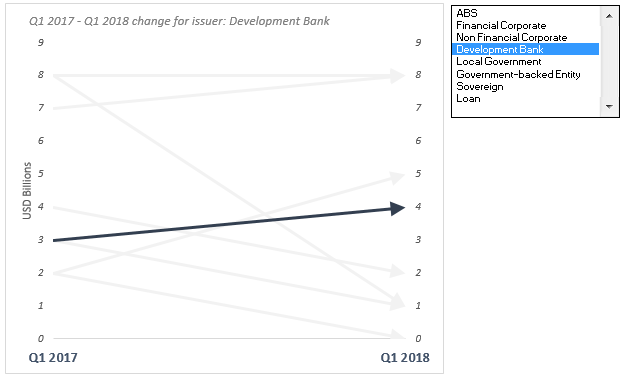
Excel Interactive Line Chart
Chart comparing Q1 2018 and Cumulative Issuance (top 15 Countries)
The chart proposed by Climate Bonds is plotting Q1 2018 on the primary axis and the cumulative issuance on the secondary one. Although conceptually this is correct, I would rather display the figures in a panel chart to make comparisons easier. I’d also differentiate the series geographically.
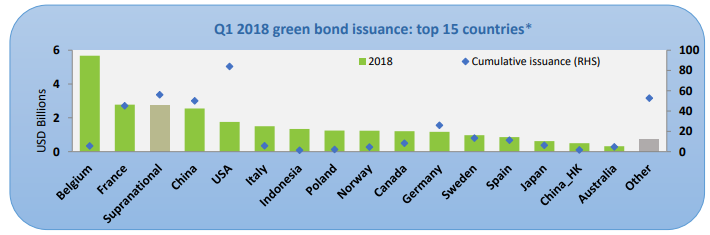
Climate Bonds chart
My suggested enhancement would be transposing the data to make it easier to read the country names and turn it into a panel chart:
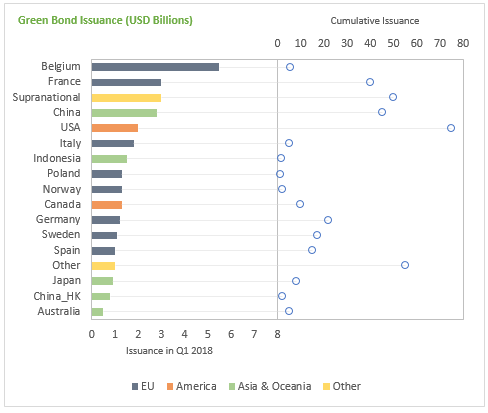
Excel Panel Charts
It is also possible to sort by cumulative issuance:
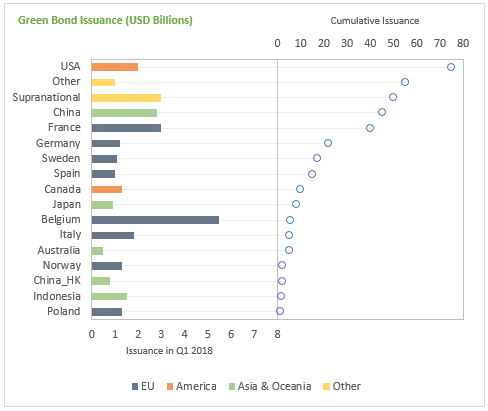
Excel Panel Charts
By coloring the series by Continent we get an additional insight which is the predominance of EU Countries in the top 15, even though the US is by far the largest issuer. Belgium is clearly the king of Q1 2018 but it is still very far off the USA in terms of cumulative issuance.
Doughnut Charts
The last series of chart proposed are a series of doughnuts charts plotting data by Issuer type. We know that Pie Charts and Doughnut charts are ineffective when plotting more than 2 or 3 series. So I would replace them with simple bar charts.
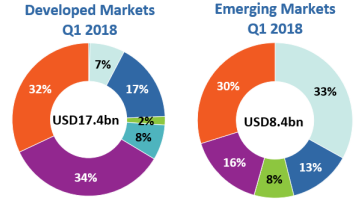
Climate Bonds Doughnut Chart
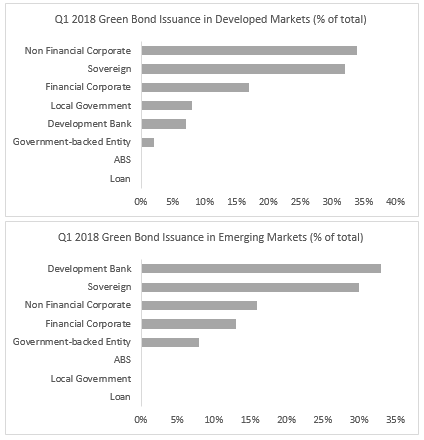
Excel Bar Charts
In the charts above I have presented some alternatives (and, in my opinion, some enhancements) to the charts proposed in the report. Feel free to post your alternatives in the comments below!