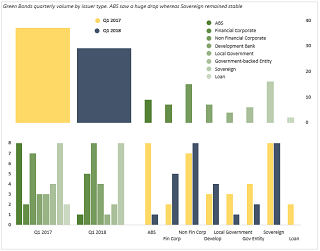
Climate Bonds Charts Yesterday I saw a post on LinkedIn where the Lux Stock Exchange was sharing some charts done by Climate Bonds. The full report can be found here. By looking at the charts I thought
Tag Archives: bar chart
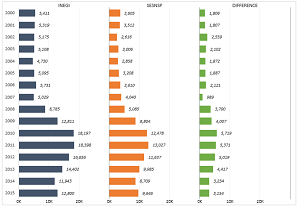
Panel Bar Chart The other day I came across a data visualization website which inspired me to replicate some of the graphs in Excel. The data shows gunfire homicides in Mexico between 2000 and 2015