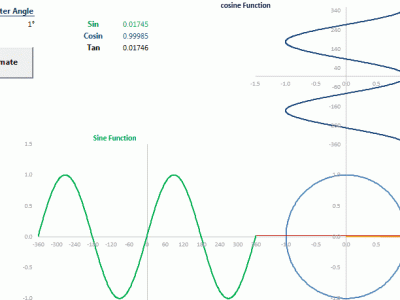
Excel Animated Sine Cosine Chart While researching on the web yesterday I saw a nice animated chart showing the sine and cosine functions connected to each point of a circle which I thought would be
Category Archives: Excel
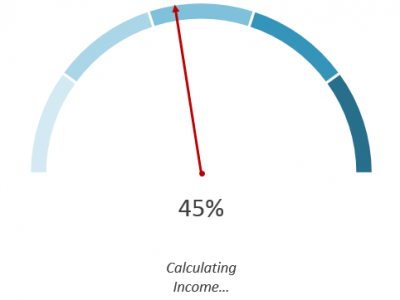
Gauge Charts A gauge chart should be used sparingly, especially in professional reports or dashboards when much better alternatives are available (bullet charts come to mind). In spite of that, it is a good Excel
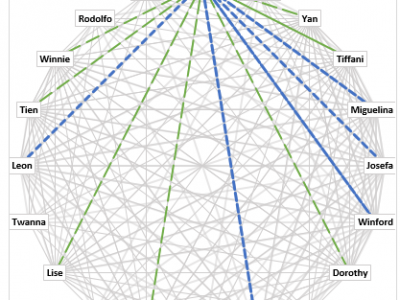
Excel People Connections Chart Download the file Suppose you have one table like the below which lists the relationship between two people: 0 No Relationship, 1 they just knows each other, 2 they are good
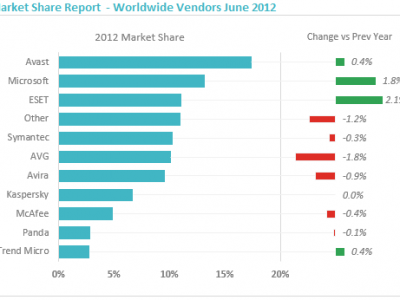
Opswat Report In this quick post I wanted to provide an alternative Excel market share chart to that found in the Opswat Report. Download the file The data is shown below. It is a simple
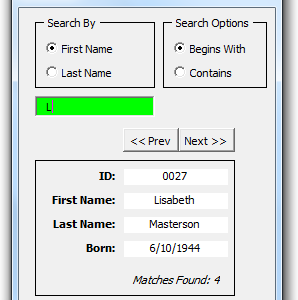
Building a searchable Userform using a Recordset In my previous post How to create a disconnected recordset I showed how to create a disconnected Recordset with ADO. Now we will use this disconnected recordset to create a
User-defined function The below UDF will list all files in all subfolders returning a one dimensional array that match the pattern provided in the argument filePattern. The pattern can include ? (question mark) that identify
Disconnected Recordsets Disconnected Recordsets are great when you want to retrieve and work with data from your database without the risk of creating conflicts with other users, in fact they are a fully functional Recordsets
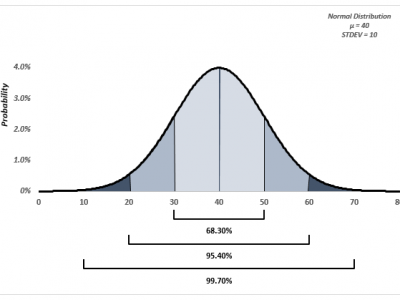
The NORM.DIST Function Download the file The NORM.DIST function, as its name implies, returns the normal distribution (continuous probability function) given the mean and the standard deviation of your observations. The NORM.DIST function can return
The Data A user on MrExcel Forum asked, given two columns one with a start date and one with an end date, for an excel formula to count the number of days which fall within a
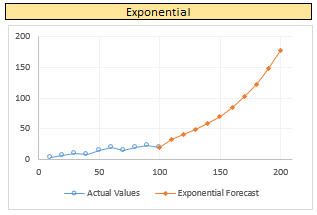
Excel Forecast Charts In the paragraphs below I will show how to calculate the different types of trendlines available in Excel charts: Linear, Exponential, Logarithmic, Polynomial, Power. Download the Excel file Given a data set

