XcelanZ

  • Python
  • Power BI
    • Power Query
    • DAX
  • Excel
    • Excel Charts
    • Excel VBA
    • Excel Formulas
  • About
  • Contact
  • Python
  • Power BI
    • Power Query
    • DAX
  • Excel
    • Excel Charts
    • Excel VBA
    • Excel Formulas
  • About
  • Contact
XcelanZ

Home

Dynamic Pareto Chart in Power BI

Dynamic Pareto Chart in Power BI

  • Livio
  • 11, 2018
  • DAX, Power BI
  • 20 comments

Dynamic Pareto Chart in Power BI In this post I want to share my technique of building a dynamic Pareto Chart. Pareto charts are used to show the 80/20 rule according to which roughly 80% of

Read More

Multiple Hierarchies in the same Visual

Multiple Hierarchies in the same Visual

  • Livio
  • 11, 2018
  • DAX, Power BI
  • 0 comments

Multiple Hierarchies Sometimes in Power BI you may want to build reports like the one in the screenshot below, where items are part of multiple hierarchies. You can see that items are categorized by color

Read More

Table.FuzzyJoin – A New Power Query Star

Table.FuzzyJoin – A New Power Query Star

  • Livio
  • 10, 2018
  • Power BI, Power Query
  • 0 comments

Power Query Table.FuzzyJoin and Table.FuzzyNestedJoin With the October 2018 release, the team at Power BI introduced two new functions in Power Query Table.FuzzyJoin and Table.FuzzyNestedJoin. These two functions essentially do the same thing, the only difference being

Read More

Dynamic Percentiles using DAX

Dynamic Percentiles using DAX

  • Livio
  • 10, 2018
  • DAX, Power BI
  • 1 comments

Dynamic Percentiles using DAX Using DAX, it is not so difficult to find out who your Top 25% Customers are for a given product and what is the Sales Amount of these Top customers.  Download

Read More

Correlation Matrix with DAX

Correlation Matrix with DAX

  • Livio
  • 10, 2018
  • DAX, Power BI
  • 7 comments

Correlation Matrix using DAX In this post I wanted to share one way you could calculate a correlation matrix by using DAX. I downloaded stock prices data from Yahoo for the month of September 2018

Read More

Converting a Number to Roman with Power Query

Converting a Number to Roman with Power Query

  • Livio
  • 09, 2018
  • Power BI, Power Query
  • 2 comments

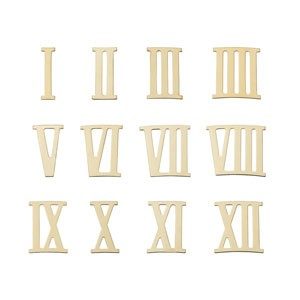
Converting a Number to Roman with Power Query In this post I wanted to share my function to convert a number to Roman numerals. The function will accept any number from 1 to 3999 and

Read More

Slow Changing Dimensions

Slow Changing Dimensions

  • Livio
  • 09, 2018
  • Power BI, Power Query
  • 0 comments

Slow Changing Dimensions Imagine you have a simple data model like the one below composed of four tables. One fact table ( Sales ) and three dimension tables (Customers, Products, Dates).  If you wanted to

Read More

Generate Combinations in Power Query

Generate Combinations in Power Query

  • Livio
  • 08, 2018
  • Power BI, Power Query
  • 3 comments

Generating Combinations in Power Query In this post I wanted to share the function I have created to generate combinations in Power Query. The function will accept two parameters. The first parameter is a list

Read More

Power Query – Add blank row at each change in value

Power Query – Add blank row at each change in value

  • Livio
  • 07, 2018
  • Power BI, Power Query
  • 26 comments

Power Query – Add blank row at each change in value This is a follow-up post to a question asked on Mr Excel forum. The OP wanted to use Power Query to add an empty

Read More

Histogram with Power Query

Histogram with Power Query

  • Livio
  • 07, 2018
  • Excel, Power Query
  • 1 comments

Histogram with Power Query With the help of custom M coding, it is possible to create a frequency distribution by using power query. This is one area where Power Pivot would shine against Power Query

Read More

Post navigation

← Older posts
Newer posts →

connect with me

Search this site

Search for:

Tags

4-4-5 Calendar 4-5-4 Calendar 544 Calendar algorithms bar chart chart charts clustering collaborative filtering combinations Combiner Functions convert to roman Correlation Data Modelling data science DAX Dot Plot excel excel charts Finance Fixed Length CSV Histogram kmeans Linear Regression List.Zip M machine learning naive bayes neural networks panel chart Pareto Analysis Power BI power query Power Query Sumproduct Python Recursive Function roman Slow Changing DImensions spam filter SQL Statistics sumproduct trigonometry vba visuals
  • Legal

connect with me

XcelanZ © 2018