Histogram with Power Query
With the help of custom M coding, it is possible to create a frequency distribution by using power query. This is one area where Power Pivot would shine against Power Query but you may have reasons to wanting to do it in Power Query: you may want to boost your knowledge of M, the results of the calculation are to be used as an intermediary step for another query, it’s good to be able to do something using different methods etc
Histogram with Power Query
The M code
The function I have created accepts 4 arguments:
1 | (MinValue as number, BucketSize as number, NumberOfBuckets as number, ListToPortion as list) as table => |
Where:
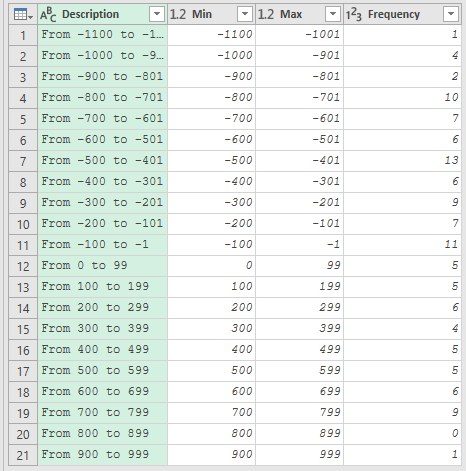
- MinValue is the value of the lower bound of the first bucket (if you are creating the following buckets: (0 to 99), (100 to 199), (200 to 299), MinValue would be 0
- BucketSize is, as the name suggests, the size of the buckets. Following the above example, this value would be queal to 100 (from 0 to 99 there are 100 items)
- NumberOfBuckets represents how many buckets you wish to create
- ListToPortion is the list you wish to create the histogram for
The full code for the function is shown below
There are some things to notice:
- The function uses List.Accumulate in order to iterate through a list that is equal to {1..NumberOfBuckets}, if NumberOfBuckets is 5, List.Accumulate iterates through 1,2,3,4,5
- At each iteration, the function calculates the LowB and UprB which are in essence the Lower Bound and the Upper Bound of each bucket. Following again the previous example, at the first iteration LowB would be = 0 and UprB = 99, at the second iteration LowB = 100 and UprB = 199 and so on
- At each iteration, the function is creating a List of 1 item and this item is a Record. This list is being appended to the list which is holding all the Records as they are get created.
- Each Record contains 5 fields. The first field (fn) is a function which is used by the last field (Frequency) in order to count how many items within ListToPortion are inside the boundaries defined by LowB and UprB
- The function returns a table
1 2 3 4 5 6 7 8 9 10 11 12 13 14 15 16 17 18 19 20 | (MinValue as number, BucketSize as number, NumberOfBuckets as number, ListToPortion as list) as table => let CreateBuckets = List.Accumulate({1..NumberOfBuckets}, {}, (state, current) => let LowB = (current - 1) * BucketSize + MinValue, UprB = (current - 1) * BucketSize + BucketSize - 1 + MinValue in state & {[ fn = (x,min,max) => x >= min and x <= max, Description = "From " & Text.From(LowB) & " to " & Text.From(UprB), Min = LowB, Max = UprB, Frequency = List.Count(List.Select(ListToPortion, each fn(_, Min, Max))) ]} ) in Table.FromRecords(CreateBuckets, type table [Description = Text.Type, Min = Number.Type, Max = Number.Type, Frequency = Int64.Type]) |
Calling the function
If you already know the parameters to pass to the function then you can simply call it within another query:
1 | H = Histogram(MinBucket, BucketSize, NumberOfBuckets, MyList) |
If instead you only have the List to Portion and know the bucket size and want to calculate dynamically MinValue and NumberOfBuckets you could do, assuming that you list of number comes from a table named “Data” within the current workbook and you wish to create buckets with the size of 100:
1 2 3 4 5 6 7 8 9 10 11 12 13 14 15 16 17 18 19 20 21 22 23 24 | let Source = Excel.CurrentWorkbook(){[Name="Data"]}[Content], MyList = Table.TransformColumnTypes(Source,{{"Data", Int64.Type}})[Data], BucketSize = 100, MinBucket = Number.RoundAwayFromZero(List.Min(MyList) / BucketSize,0) * BucketSize, MaxBucket = if List.Max(MyList) <= 0 then Number.RoundTowardZero(List.Max(MyList) / BucketSize,0) * BucketSize else Number.RoundAwayFromZero(List.Max(MyList) / BucketSize,0) * BucketSize, NumberOfBuckets = (MaxBucket - MinBucket) / BucketSize + 1, H = Histogram(MinBucket, BucketSize, NumberOfBuckets, MyList) in H |
I hope find this useful and see you at the next post!
Must read books if you want to become a Power Query guru:
May I know why am I getting this “Expression.Error: The name ‘Histogram’ wasn’t recognized. Make sure it’s spelled correctly”