Correlation Matrix using DAX
In this post I wanted to share one way you could calculate a correlation matrix by using DAX. I downloaded stock prices data from Yahoo for the month of September 2018 for five different companies. The demo data is shown below:
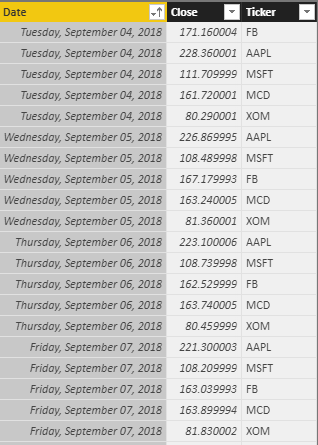
The data goes from September 4, 2018 to September 28, 2018. Afterwards, I have build the below data model:
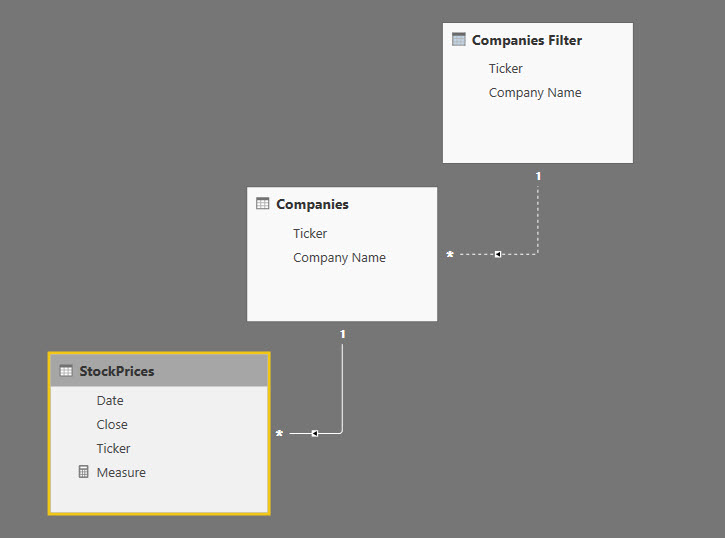
As you can see, I have normalized the ticker symbol: the table Companies is linked via a one to many relationship with the StockPrices table whereas Companies Filter and Companies are linked via a relationship which is being kept inactive.
Building the Matrix
Now we can start building our matrix. I added a matrix visual and placed ‘Company Name‘ from the Companies table in the rows section of my matrix and ‘Company Name‘ from the ‘Companies Filter’ table in the columns section of my matrix.
As soon as you have added those two fields, you may be seeing something like this:

This is totally normal and will disappear once we add our measure.
Creating the measure
Those of you who are statistics gurus do not need to be reminded of the correlation formula which is: Covariance ( x, y ) / ( StandardDeviation(x) * StandardDeviation(y) )
I will identify the companies coming from the Companies table as Stock1 and the companies coming from the ‘Companies Filter’ table as Stock2.
The standard deviation of Stock1 is calculated in the context of the active relationship between StockPrices[Ticker] and Companies[Ticker], therefore it is simply:
VAR StDevStock1 = STDEV.P ( StockPrices[Close] )
On the other hand, the standard deviation of Stock2 needs to be calculated in the context of the inactive relationship between Companies[Ticker] and CompaniesFilter[Ticker]. Therefore in our filter expression within CALCULATE we need to remove filter to the StockPrices table coming from the Companies table and activate the relationship between Companies[Ticker] and CompaniesFilter[Ticker]. This is accomplished in the following way:
VAR StDevStock2 =
CALCULATE (
STDEV.P ( StockPrices[Close] ),
ALL ( Companies[Company Name] ),
USERELATIONSHIP ( ‘Companies'[Ticker], ‘Companies Filter'[Ticker] )
)
In order to calculate the covariance between Stock1 and Stock2, first need to calculate the average price of Stock1 and Stock2. This is done following the same logic of the standard deviation. Therefore the two measure are:
VAR AvgStock1 =
AVERAGE ( StockPrices[Close] )
VAR AvgStock2 =
CALCULATE (
AVERAGE ( StockPrices[Close] ),
ALL ( Companies[Company Name] ),
USERELATIONSHIP ( ‘Companies'[Ticker], ‘Companies Filter'[Ticker] )
)
Once we have calculated the two averages, we can go ahead and calculate the Covariance. The Covariance is calculated by summing the products of the deviations of Stock1 and Stock2 from their respective averages and dividing the result by the number of observations:
VAR Covar =
SUMX (
StockPrices,
( [Close] – AvgStock1 )
* (
CALCULATE (
MAX ( StockPrices[Close] ),
ALLEXCEPT ( StockPrices, StockPrices[Date] ),
USERELATIONSHIP ( Companies[Ticker], ‘Companies Filter'[Ticker] )
)
)
)
/ COUNTROWS ( StockPrices )
Putting together all our measure will yield the final measure:
Correlation =
VAR AvgStock1 =
AVERAGE ( StockPrices[Close] ) — average price of stock 1
VAR AvgStock2 =
CALCULATE (
AVERAGE ( StockPrices[Close] ),
ALL ( Companies[Company Name] ),
USERELATIONSHIP ( ‘Companies'[Ticker], ‘Companies Filter'[Ticker] )
) — average price of stock 2
VAR StDevStock1 =
STDEV.P ( StockPrices[Close] ) — standard deviation of stock 1
VAR StDevStock2 =
CALCULATE (
STDEV.P ( StockPrices[Close] ),
ALL ( Companies[Company Name] ),
USERELATIONSHIP ( ‘Companies'[Ticker], ‘Companies Filter'[Ticker] )
) — standard deviation of stock 2
VAR Covar =
SUMX (
StockPrices,
( [Close] – AvgStock1 )
* (
CALCULATE (
MAX ( StockPrices[Close] ),
ALLEXCEPT ( StockPrices, StockPrices[Date] ),
USERELATIONSHIP ( Companies[Ticker], ‘Companies Filter'[Ticker] )
)
)
)
/ COUNTROWS ( StockPrices ) — covariance between stock stock 1 and stock 2
VAR Correl =
DIVIDE ( Covar, StDevStock1 * StDevStock2 ) — final correlation
RETURN
Correl
Once you add the measure to the Matrix, the results will be displayed ( in my matrix I have removed the totals from the visual as they are not needed ):
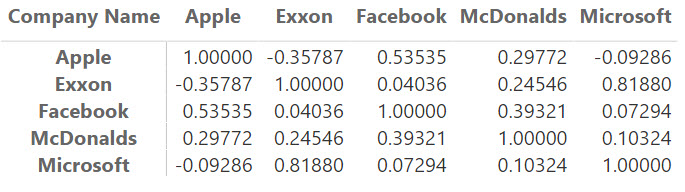
DAX Correlation Matrix
You can also display the results in a table visual:
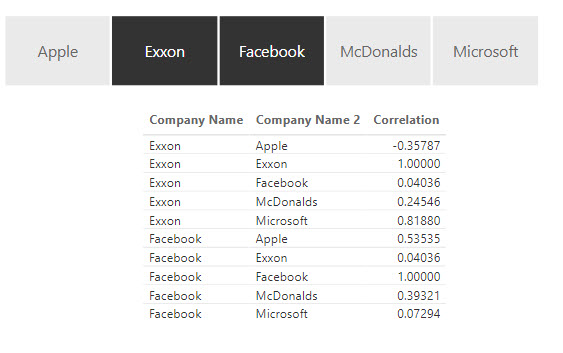
DAX Correlation Matrix
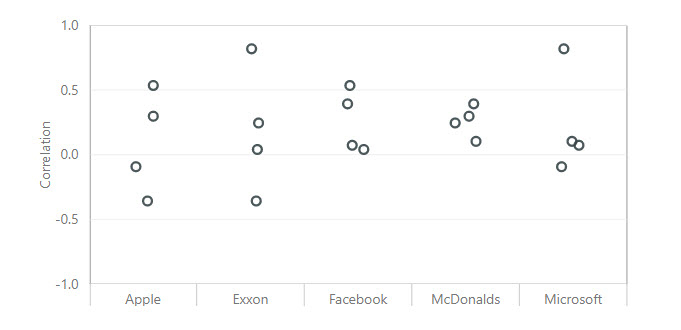
Or in a dot plot ( I have used the one from MAQ Software ):
Hi,
In the Covariance calculation, it seems to me that we are missing the calculation of the deviation of Stock2 before multiplying by Stock1 deviation. Am I missing something here?
Thanks,
Matthew Theis
I was wondering the same. I’m new to this and I might be misunderstanding something (or a lot), but shouldn’t AvgStock2 be included in the Covariance calculation?
Hello Bror, Matthew
the covariance formula is:
which can also be written as:
But we have the following equivalences and they can cancel each other out:
Therefore you can write the covariance in one of the two following ways:
Hi Livio,
Thank you very much for sharing this Correlation Matrix using DAX that I was looking for a long time !
Please how can I insert heatmap as on this image :
https://miro.medium.com/max/875/1*1nwx10aXWskPxbrtNa00tA.png
Do I need to add Dax code ?
Thanks,
Jaouad
Thank you so much it helped a lot
Thanks load for the detailed explanation. I just changed the COUNTROWS function to COUNTA to take into account NULL values in my dataset.
Thank you for your recommendations. It was really helpful, I took your approach. Thank you.
if it’s not difficult for you to tell if there is a solution – how to calculate the average correlation based on your correlation matrix. Thanks